
Graphics Overview
The hardware inside a PC which handles video display processing comes in two basic grades; integrated and dedicated. Integrated graphics is what you’ll find in 90% of PCs sold and should be adequate for your Mom. The integrated graphics chip comes built directly into the motherboard and borrows whatever memory the system will loan it. If you are doing any 3D anything (gaming or modeling) you should have a dedicated Graphics Processing Unit (GPU) with a separate supply of Video RAM (VRAM) to avoid potential performance problems. Dedicated graphics for desktops and workstations is sold on expansion cards that plug into the motherboard. There are around a half dozen common manufacturers of graphics cards such as eVGA, BFG, Matrox, MSI, PNY, and XFX. Today, nearly all of these manufacturers buy the GPUs for their cards exclusively from NVIDIA or ATI (AMD) whose brand names tend to overshadow the card manufacturers.
NVIDIA calls itself the World Leader in Visual Computing Technologies. They evidently do have a large lead in market share for dedicated GPUs. They do over US $3 Billion in sales annually. I’m not an expert on hardware, but from what I’ve read there is every reason to be impressed with their history of consistent innovation in a competitive market. So when NVIDIA tells you that you need to spend an extra $600-$3,000 on your dedicated graphics because you are a professional user of 3D, you might not question that recommendation. If you look at the NVIDIA partner list for these professional level graphics, you’ll see many of the big name corporations in engineering and graphics software. ATI also has a professional-grade set of products at similar price premiums over their consumer-grade products. So the whole industry seems to agree that these professional-grade cards are necessary. What kind of people would dare question the accepted practices of the entire design industry? I think you know the type…
Trouble
For me, it all started very innocently. I actually wanted to learn about the differences between the consumer and professional grades of cards so that I could make clear recommendations to our customers about why they needed the professional cards. The trouble was that when I looked around, I noticed that no one ever makes a direct claim regarding the capabilities of these professional cards over the consumer ‘gaming’ cards. I realized it could just be that the marketing people at NVIDIA, ATI, and all of their manufacturers don’t understand the differences, so they can’t communicate it. So I dug just a little deeper.
The most knowledgeable sounding information I found said that the GPUs are actually the same between these product lines and that the differences lie in the firmware on the card. That seemed a bit hard to believe. It almost sounded like there was something sinister being hidden in those vague marketing claims. More digging uncovered benchmarks (written by publishing companies who are supported by NVIDIA advertising) which confirmed that MCAD software designed to work with Quadro (certified by NVIDIA) perform better with Quadro GPUs. But I found still more underground discussions and benchmarks showing that a ‘soft-mod’ (firmware change) can be applied to the GeForce cards so that it reports itself as a Quadro to the driver. This soft-mod significantly increased performance in tested MCAD software (typically Pro/E, SoildWorks, CATIA, etc.). Apparently the GPUs used between the consumer and professional product lines ARE the same, at least in some cases.
But this is not necessarily sinister. It seems there are special features designed into the shared GPUs which are not useful for gaming performance so they are turned off via firmware for the consumer market. Games are usually dealing with 100% shaded polygon data. CAD data often is or includes curves and lines. Turning on these features for the ‘professional’ card pulls resources from the main shaded polygon display calculations to process the curves and lines with special techniques optimal to those data types. This whole strategy is now over 10 years old and conceived at a time when OpenGL was king.
Testing KeyCreator
So, theoretically, the professional cards should out-perform the gaming cards when asked to handle 3D wireframe data. The only way to know for sure what performance each GPU would get with KeyCreator was to conduct an experiment with several of both types. Instead of a subjective feel for how well the display updated, I wanted to measure actual frame rates. Frames-per-second (fps) is a standard measure of how smoothly the display of a 3D model can be manipulated - higher frame rate indicate better performance. Frame rates above 25-30 are generally acceptable. Rates below 10 are painfully frustrating.
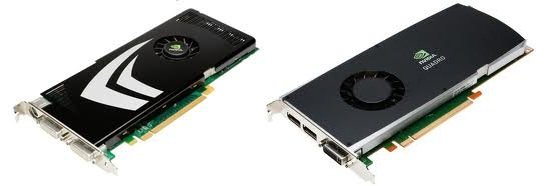
To make these tests mean as much as possible I eliminated as many variables as was practical. I started by purchasing a new workstation with a 900W power supply to conduct the tests on (double the Watts of a typical machine). The extra available power should eliminate potential problems with higher-end cards that demand significant power. Next I decided to stick to a single brand of GPU and card manufacturer. PNY manufactures popular NVIDIA-based cards in the consumer line (GeForce) and the professional line (Quadro) so that’s what I used. This choice also allowed use of one driver version across all tests. To keep costs of this experiment reasonable I picked four PNY cards to represent the two product lines.
During testing I discovered that frame rates almost always climbed 5-10% over several sequential repeats of the test. The results I recorded were the maximum frame rate observed. I also found that closing KeyCreator and restarting it typically boosted frame rate results by 3-10%. Once I figured that out I re-ran all tests with a fresh launch of KeyCreator. However these results may still contain some variation due to such factors and potential heating of hardware over time which I did not attempt to measure or control.
Results 1 - OpenGL
I began by testing each of these cards in KeyCreator 9.0.3 with Graphics Type setting on Hardware OpenGL. Test 1a used a complex 21 MB solid (53,000 facets) in shaded HLR render mode. To make the test a little more challenging the model was made 50% transparent (with 3 layer depth peel) for Test 1b.
|
GPU |
Memory |
Price Paid US $ |
Test 1a |
Test 1b |
|
GeForce GT 220 |
1 GB DDR2 |
$79.99 |
64 fps |
29.5 fps |
|
GeForce 9800 GT |
1 GB GDDR3 |
$139.99 |
64 fps |
61.9 fps |
|
Quadro FX 580 |
512 MB GDDR3 |
$147.79 |
62 fps |
53.5 fps |
|
Quadro FX 3800 |
1 GB GDDR3 |
$819.99 |
62 fps |
62 fps |
In OpenGL frame rates max out around 60-65 fps which is a nice smooth display no one would complain about. In test 1a, none of the cards were challenged. Test 1b results show that performance with the lowest priced card does start to drop off. However, the more expensive Quadro cards did not provide improved frame rates in KeyCreator over the reasonably priced higher-end gaming card.
From here I decided to look for larger models that might show more performance difference between the two best of these four cards.
|
Model |
Model Size |
Contents |
$800 Quadro |
$150 GeForce |
|
2 |
42 MB |
1,595 solids |
20 |
20 |
|
3 |
221 MB |
50 spheres with 500 holes each |
60.1 |
62.1 |
|
4 |
153 MB |
149 solids |
38.4 |
21.8 |
|
5 |
170 MB |
10 solids (perforated sheet metal) |
61.9 |
60.1 |
|
6 |
90 MB |
1,256 solids |
19.8 |
15 |
Frames-per-second performance of KeyCreator 9, OpenGL, Shaded HLR mode
Clearly a few of these models are taxing the abilities of these cards. This data shows that the Quadro FX 3800 performance basically tied the GeForce 9800 GT card with most of these challenging models. With one model (#4) out of six tested the Quadro card did clearly out-perform the GeForce card. That model (#4) was the only one in this set of tests which contained transparency (2 solids were 50% transparent), so my next test looked into that.
|
Model |
Model Size |
Contents |
$800 Quadro |
$150 GeForce |
|
1 |
21 MB |
1 solid, 50% transparent |
62 |
61.9 |
|
2 |
42 MB |
1,595 solids, 1 solid with 50% transp. |
9.9 |
6.6 |
|
4 |
153 MB |
149 solids, 2 solids with 50% transp., cutting plane |
32 |
22.9 |
Frames-per-second performance of KeyCreator 9, OpenGL, Shaded HLR mode with potions transparent
Neither card had any trouble adding transparency to model #1 which contains just one solid. This same test on model #2 demonstrates that calculating transparency display in relation to other non-transparent solids does present an additional challenge for both cards. The Quadro card handled the addition of transparency to model #2 better than the GeForce card but both dropped into a frame rate range I classify as poor performance. Trimming model #4 in half with a cutting plane hurt the performance of the Quadro but slightly improved the performance of the GeForce.
Theoretically, the Quadro is supposed to be handling wireframe data better than its GeForce sister. The next set of tests was done in Wireframe render mode to see if the extra features of the Quadro would kick in.
|
Model |
Size |
Contents |
$800 Quadro |
$150 GeForce |
|
2 |
42 MB |
1,595 solids |
40.8 |
30 |
|
3 |
221 MB |
50 spheres with 500 holes each |
62.1 |
49.3 |
|
4 |
153 MB |
149 solids |
60.1 |
30 |
|
5 |
170 MB |
10 solids (perforated sheet metal) |
61.9 |
61.9 |
|
6 |
90 MB |
1,256 solids |
30 |
20 |
Frames-per-second performance of KeyCreator 9, OpenGL, wireframe render mode
This set of results was the most conclusive of all OpenGL tests. Both cards had better frame rates on most of the models with the shaded facets removed from the display and only the wireframe edges shown. However, the performance of the Quadro card in this mode was 25-50% better than the GeForce card with most of the models tested. This makes perfect sense considering the theoretical advantages which the Quadro card should have with this data type.
Conclusion – OpenGL
The $800 Quadro card did out-perform its $150 GeForce sister in 9 of 15 OpenGL tests, most significantly when using wireframe display mode. This advantage may not matter since most users today are not using wireframe display mode frequently. Modern GPUs allow excellent to reasonable performance in shaded modes and models are usually far easier to visualize in shaded mode. In 4 tests the performance was tied and in 2 tests the GeForce out-performed the Quadro.
I think these test conclusively say that the Quadro does deliver some benefit. Is it $650 worth? If you are running OpenGL, frequently use wireframe render mode, and have a nice budget, OK. If it was my money I’d pick the GeForce and spend the $650 savings on an upgraded processor, 2 GB more RAM, and a liquid CPU cooler - so cool.
Next Week
The same set of tests was done in Direct3D mode. Next week I’ll report on the Direct3D results.